Author's note. This article was originally published in SunWorld's September 1999 issue. SunWorld.com no longer exists and redirects the browser to ITworld. This copy of the article is a copy of the article that was on SunWorld's site.
There is a copy of the original article on another site, but it's not clear how long this copy will stay there.
In July, Blair Zajac described the benefits of installing a real-time monitoring system for Solaris systems and described several freely available tools that allow system administrators to manage and monitor short-term problems and long-term trends for capacity planning. This month we take the same concepts and apply them to your network. Here we examine network monitoring protocols and tools.
Networks that continually grow, such as the networks at Yahoo!/GeoCities, and even those that do not, have a tendency to exhibit strange behavior at times. In addition, capacity planning is extremely important, since turning away customers because your web site is too slow is tantamount to corporate suicide. Both of these require some form of network measuring, monitoring, event trapping and traffic plotting.
Following on my previous article, I will take a look at publicly and freely available tools to monitor your network. These tools are similar to the Orca tool presented in the previous article that monitors Sun Solaris systems, but are designed to monitor SNMP agents instead of servers.
The precepts surrounding system monitoring are also applicable here. For medium to large sites, large amounts of data will be collected and it must be collated to allow easy viewing. The requirements of such a system are:
To monitor many boxes.
Measure and display short- and long-term data.
Allow easy comparison of the same measurement between different systems.
Allow easy view of all system measurements on different time scales.
Keep plots available and up to date.
To get into network monitoring, I will examine the most common protocol used used to monitor network hardware, the Simple Network Management Protocol (SNMP), look into some publicly available tools that can communicate with network hardware using SNMP, and finally look at some utilities such as MRTG and Cricket that use these tools to present the gathered data.
I will quickly go over the structure and design of the Simple Network Management Protocol (SNMP) as it applies to this article so when you set up your own network monitoring system, you will have a basic understanding of the different terminologies, and most importantly, MIBs and OIDs, which allow you to point your monitoring tools at new SNMP variables. I will discuss SNMPv1, which is still found on much hardware. SNMPv3 is the latest SNMP available.
SNMP is the protocol used to manage, control, and receive error messages and alert conditions from network hardware. SNMP is a client/server protocol, where the server (agent), or the Managed Network Entity, is located on the network hardware being managed, and the client is specialized software running on a Network Management Station (NMS). To keep the agent on the network hardware small, simple and easy to implement, agents just gather data and let the NMS handle the gathering, collation, and presentation of this data to the network administrator.
SNMP makes use of UDP port 161 to communicate. TCP is not used because the overhead is not required. If a packet is lost, then the NMS will resend its request. No sequencing is needed since all the requests and responses fit inside a single datagram.
SNMP separates the specifics of what data is available on a particular SNMP agent from the method of getting and setting data on the agent. For example, SNMP does not know that a NFS server with a SNMP agent can report the disk usage on a particular volume. This information is supplied separately in a Management Information Base (MIB) which is used by the NMS. Several standard MIBs exist, such as a MIB for TCP/IP statistics known as MIB-II. This MIB contains statistics such as the uptime of the SNMP agent, the number of TCP/IP packets received and sent, the number of currently established TCP connections.
A MIB is a tree structure of globally unique Object IDentifiers (OID). A separate list of rules, the Structure of Management Information (SMI) described in RFC 1155, define and identify OIDs. The SMI specifies that OIDs must be specified using ISO's Abstract Syntax Notation 1 (ASN.1). ASN.1 is a formal language that allows for both a human-readable description and a compact description for computer reading. It specifies exactly how to encode both names and data into messages for network transport. Using ASN.1 removes any ambiguity about the data representation. For example, instead of specifying an integer value, ASN.1 requires an exact form and range for the integer.
Object identifiers in a MIB are structured in a hierarchical tree managed by ISO and ITU that define globally unique variables in a manner similar to how DNS defines globally unique hosts. An OID is a sequence of integers which traverse a global tree. The tree consists of a root connected to a number of labeled nodes via edges. Each node may, in turn, have children of its own which are labeled. A label is a pairing of a brief textual description and an integer. Authority for portions of the namespace are assigned to other organization, much in the same way that DNS delegates the authority for individual domains to individuals or organizations.
The OID space is more general than the description of variables in network boxes. OIDs can also be associated with standards documents. The root of OID space is unnamed and has three direct nodes managed by ISO iso(1), ITU itu(2) and jointly by ISO and ITU joint-iso-itu(3). The number following the name is the numeric identifier for a particular node. All OIDs of interest on the Internet are rooted under iso(1), under which is a subtree for national or international standard organizations named org(3). The U.S. National Institute for Standards and Technology allocated a node under org for the for the Department of Defense named dod(6). The Internet Activities Board then petitioned the DOD for a node for the Internet community. This node is named internet(1) and it contains a node named mgmt(2) and under this node are the OIDs for network and system management.
At this point some examples of the OID naming scheme would be helpful. If you wanted to know the number of currently established TCP connections then the name would be
iso.org.dod.internet.mgmt.mib.tcp.tcpCurrEstab
Numerically this would be 1.3.6.1.2.1.6.9, 1 from iso, 3 from org, 6 from dod, 1 from internet, 2 from mgmt, etc. Since all OIDs fall under the mgmt node, they all begin with the prefix 1.3.6.1.2.1.
Two MIBs, MIBI and MIBII, are standard and supported by every agent. MIBII is a superset of MIBI and is the standard for monitoring TCP/IP. Vendors can provide their own MIBs for specific hardware. Under the internet(6) node is a private(4) node which contains an enterprises(1) node. In this node you will find the OIDs for vendor specific hardware, such as routers, switches and hubs.
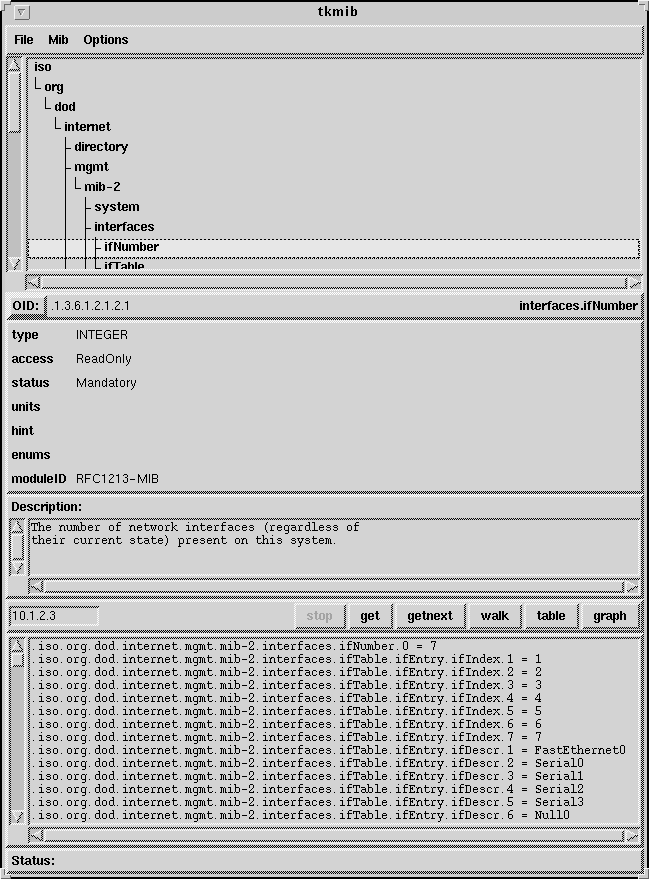
Because reading the numeric OID can be hard for us humans, a
useful tool for examining the MIB and getting specific values from
a host is tkmib, which comes with the UCD-SNMP
distribution, described below. Below I show tkmib
directed to one of our routers. Notice that it shows the MIB tree
in the top window. I have selected the
iso.org.dod.internet.mgmt.mib-2.interfaces.ifNumber OID and it
shows the numeric form as 1.3.6.1.2.1.2.1. It also displays some
information about this OID farther down in the window. At the
bottom it shows a walk of the
iso.org.dod.internet.mgmt.mib-2.interfaces OID I did earlier.
This tool is a great time saver.

SNMP implements a fetch-store paradigm for operations instead of defining a large set of commands. In the original version of SNMP there are only five types of messages:
Command Meaning Get Get a value from a specific OID GetNext Get a value without knowing its exact name Response Reply to a get operation Set Set a specific variable to a specific value Trap Reply to a triggered event
The NMS typically polls each agent in regular intervals. However, if a problem occurs, then the NMS may not pick up on it immediately. For this reason, the agent can be programmed to generate a trap upon a predefined event. The trap event is sent to the NMS on UDP port 162.
To communicate with an SNMP agent, the last issue to discuss is security. The original SNMP specification used a simple, in fact almost non-existent, security model. Access to an SNMP agent is divided into groups called communities. The community names are in effect passwords and if the community name is known, then you can access the SNMP agent. The community string is transmitted as plain text in the SNMP packet. Later versions of SNMP have greatly improved the security model, but I will not discuss that here. Most agents have two community names. The first is public and the second is private, which has more access to the SNMP agent.
Sun includes an SNMP agent in Solaris 2.6 and above. It installs as the Solstice Enterprise Agents (SUNWCsea) cluster which contains the SUNWmibii, SUNWsacom, SUNWsadmi, and SUNWsasnm packages. In addition, SyMON contains a more comprehensive SNMP agent and client system for monitoring hosts.
A popular freely available SNMP client and server combination
for many hosts is the UCD-SNMP package. This software builds on
many different Unix flavors and provides both an SNMP agent and
SNMP clients for getting and setting SNMP variables. In addition,
UCD-SNMP provides a tkmib program to view the tree
structure of a MIB and get OID values from an SNMP agent.
Additional MIBs from vendors can be loaded into UCD-SNMP. For
example, I loaded Network Appliances Filer MIB to query the box on
the disk usage for all of its volumes.
I will quickly describe the steps to download and install
UCD-SNMP with its associated tkmib program. I will
not go into the steps to install this package as an SNMP agent on
your host.
The UCD-SNMP's home page is at http://net-snmp.sourceforge.net/. The distribution can be downloaded from its SourceForge site. Get the latest version, uncompress and untar this file into a working directory, then cd into it.
Now run ./configure --help and take a look at the
different configuration options. Choose any options that are
pertinent to you. If you are going to use a Perl SNMP module
later on, then you will want to use the
--enable-shared library to build a shared libsnmp.so
library for later use. If you want to install this in someplace
else than /usr/local, then you will need to use the
--prefix=/path/to/install/dir option.
Now run ./configure with all the options you want.
It will check for the capabilities of your system and compiler and
set up the codes to compile and run properly on your system.
Finally, do a make install to install it in its final
location.
If you wanted to get the uptime of the SNMP agent, you can run
the following command using the UCD-SNMP snmpwalk
program:
% snmpwalk 10.1.2.3 community system.sysUpTime
system.sysUpTime.0 = Timeticks: (1216034184) 140 days, 17:52:21.84
The first argument to snmpwalk is the IP address
or name of the SNMP agent. The next argument is optional and is
the community name to gain access to the SNMP agent.
If you want to build and use tkmib, then you will
need to build and install the Perl SNMP and Tk modules. This is
described below.
There are two different SNMP modules to get/set SNMP variables from Perl.
The first, written by G.S. Marzot, is simply named SNMP and
links against UCD-SNMP's libsnmp.so library. The current version
is 1.8.1 and is available from the
CPAN archive. Get the latest version and run the following
commands. The installation will ask for the location of the
UCD-SNMP include files and library. Use the include and lib
directory from the prefix given to the ./configure
step above. If you did not use a --prefix= command line
option to ./configure, then the location will be
/usr/local/include/ucd-snmp and /usr/local/lib.
% gzcat SNMP-1.8.1.tar.gz | tar xf -
% cd SNMP-1.8.1
% perl Makefile.PL
Where are the libsnmp.a include files? [/usr/local/include/ucd-snmp] /usr/local/include/ucd-snmp
Where is libsnmp.a installed? [/usr/local/lib] /usr/local/lib
Checking if your kit is complete...
Looks good
Processing hints file hints/solaris.pl
Writing Makefile for SNMP
Enter host and community for SNMP tests:  [localhost private]
The last line is the hostname and community name of a host to test SNMP against. This is not crucial if you do not have a box with an SNMP agent.
To get tkmib running you will need to download and
install the Perl Tk module. The latest version is 800.015 and is
available at CPAN.
Follow the same steps as above for the SNMP module:
% gzcat Tk800.015.tar.gz | tar xf -
% cd Tk800.015
% perl Makefile.PL
perl is installed in /home/bzajac/opt-i386-solaris/perl5/lib/5.00503/i86pc-solaris okay
PPM for perl5.00503
Test Compiling config/signedchar.c
Test Compiling config/Ksprintf.c
Test Compiling config/tod.c
Generic gettimeofday()
/usr/X/bin/xmkmf suggests /usr/openwin
Using -L/usr/openwin/lib to find /usr/openwin/lib/libX11.so.4
Using -I/usr/openwin/include to find /usr/openwin/include/X11/Xlib.h
Writing Tk/Config.pm
Writing pTk/tkConfig.h
.
.
.
% make
% make test
% make install
Make sure that the Makefile.PL found the X include and library files you want.
Now the installed tkmib should run. You may need
to fix the first line of tkmib to point to the
correct version of Perl however.
The second Perl SNMP module is written by Simon Leinen. The primary difference between this package and the previous one is that this package is written completely in Perl and does not rely upon nor link with any other libraries. This module is used both by both MRTG and Cricket, two network monitoring tools described below. One main disadvantage of this package is that it only understands numeric OIDs.
In this section I will describe the various real-time monitoring solutions for networks. Sun's SyMON does a great job of monitoring many hosts for events using SNMP but it does not record and plot data. For monitoring the short- and long-term capacity issues, I will examine the MRTG and Cricket tools.
MRTG, short for the Multi Router Traffic Grapher, and Cricket are very similar in a broad design goals and effort but are significantly different. Both generate HTML pages containing GIFs or PNGs (a new image format that does not have the patent issues that GIF does) of recorded data. Plots are generated showing multiple timespans, such as daily, weekly, monthly, and yearly. The binary data files do not grow over time. Both are freely available on the web, written in Perl, use the SNMP_Session Perl module described above, and use C code to store and graph data. Typically a crontab entry is set up to run the data collection tool every five minutes.
In the details, Cricket and MRTG are quite different. They are installed and set up in completely different manners. MRTG is simpler to install and set up, but Cricket is faster and more flexible. MRTG forks a separate process for each image or data update while Cricket dynamically loads the RRDtool library, which I discussed in my previous article. Cricket does not generate the images until a user points their browser at a CGI script that generates the images on the fly.
Both tools are widely used in the network community. People use it to measure the backplane bandwidth usage on their Cisco routers, the amount of traffic passing through a particular port on a switch to measuring the CPU usage on routers.
Installing both of these packages requires some work. Because of the patent issues surrounding GIF creation code, the libraries that were used to create GIF images have been converted to generate PNG images. While PNG images are smaller and take less time to compress, installing the code requires the libpng and libz libraries. Get these tools from the following places:
Tool Location Description zlib http://www.gzip.org/zlib/ Compression library used to make PNGs PNG http://www.libpng.org/pub/png/libpng.html PNG creation library GD http://www.boutell.com/gd/ Graphics library for creating images SNMP_Session http://www.switch.ch/misc/leinen/snmp/perl/ Perl SNMP library MRTG http://people.ethz.ch/~oetiker/webtools/mrtg/ Traffic measuring and bandwidth plotting tool Cricket http://cricket.sourceforge.net/ Traffic measuring and bandwidth plotting tool
MRTG, written by Tobias Oetiker, generates web pages like these:
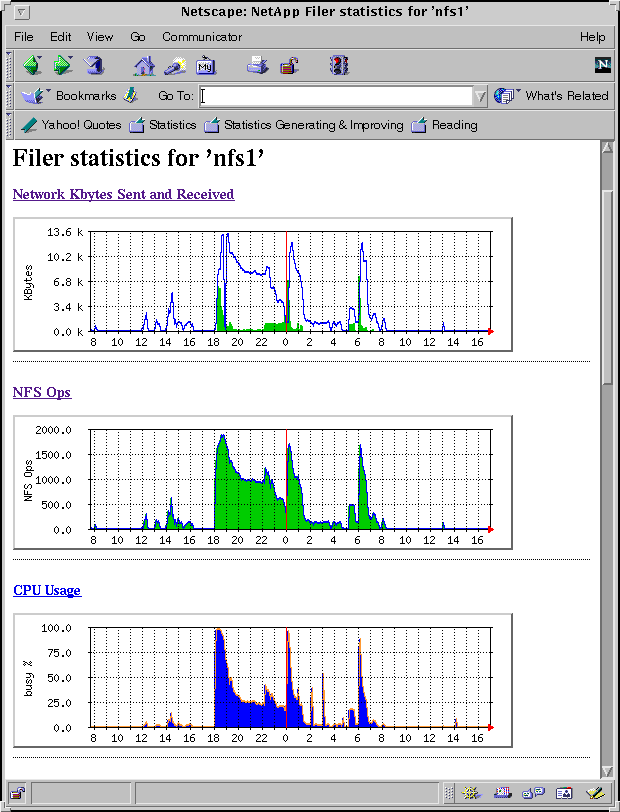
Here a portion of a web page is shown displaying the network traffic, NFS operations per second, and CPU usage for a Network Appliances NFS Filer. Clicking on one of the images leads to a page showing the daily, weekly, monthly, and yearly plots. Here are the plots for the number of NFS operations per second:


Once you have downloaded, configured, and compiled MRTG, it is straightforward to set up monitoring of a new router or host. In this example, I point MRTG at the SNMP running on a Solaris 2.6 host. Simply run the following commands:
% pwd
/home/blair/mrtg-2.8.6
% mkdir /home/blair/www/mrtg
% cp images/* /home/blair/www/mrtg/
% ./run/cfgmaker public@dagalas > dagalas.cfg
% vi dagalas.cfg
  Here add the line WordDir:/home/blair/www/mrtg mentioned at the top
  of the file.

  Also make sure all MaxBytes settings are large enough for the interface
  being monitored.  Sometimes cfgmaker gets this value too small and
  all recorded data that is larger than this value will be ignored.

  Add a new argument to each target to have the image plot the newest data
  at the right side of the plot.  Options[XXX]: growright.  Otherwise new
  data will appear at the left end of the generated images.
% ./run/mrtg dagalas.cfg
Rateup WARNING: ./run//rateup could not read the primary log file for dagalas
Rateup WARNING: ./run//rateup The backup log file for dagalas was invalid as well
Rateup WARNING: ./run//rateup Can't remove dagalas.old updating log file
Rateup WARNING: ./run//rateup Can't rename dagalas.log to dagalas.old updating log file
% ./run/mrtg dagalas.cfg
Rateup WARNING: ./run//rateup Can't remove dagalas.old updating log file
% ./run/mrtg dagalas.cfg
% ./run/indexmaker dagalas.cfg > /home/blair/www/mrtg/index.html
Put the mrtg command in your crontab to run every five minutes and you are done. Now just point your browser at the directory and you will see the new results.
In examining the configuration file cfgmaker creates you will see lines like:
Target[XXX]: 1:public@dagalas
This will get the traffic for port 1 of the machine named dagalas using the community 'public' for the SNMP query. You can also define the exact OID using the following syntax 'OID_1&OID_2:community@router'. The following example will retrieve error input and output octets/sec on interface 1. MRTG needs to graph two values, so you need to specify two OID's such as temperature and humidity or error input and error output.
Target[XXX]: 1.3.6.1.2.1.2.2.1.14.1&1.3.6.1.2.1.2.2.1.20.1:public@myrouter
This is where having tkmibavailable to get the
numeric OID values is extremely useful.
Cricket is a relatively new tool compared to MRTG. It is written by Jeff Allen and is based on Tobias Oetiker's new Round Robin Database (RRD) library.
There are several differences between MRTG and Cricket. It is significantly faster than MRTG in gathering SNMP statistics and in updating the binary data files. Cricket also leaves image creation to viewing time by having a CGI create the images. This saves CPU time on the system for other purposes, but increases the users wait for viewing. The other large improvement is the creation of an inheritance tree of configuration files. A top level configuration file can set global parameters that may or may not be overridden in lower configuration files. Lower levels of the tree set more specific targets to monitor. This is extremely useful for large sites, as it lets different organizations handle different portions of the configuration tree.
A top level page in viewing a Cricket installation is shown below. This is from the Cricket author's demonstration web site.
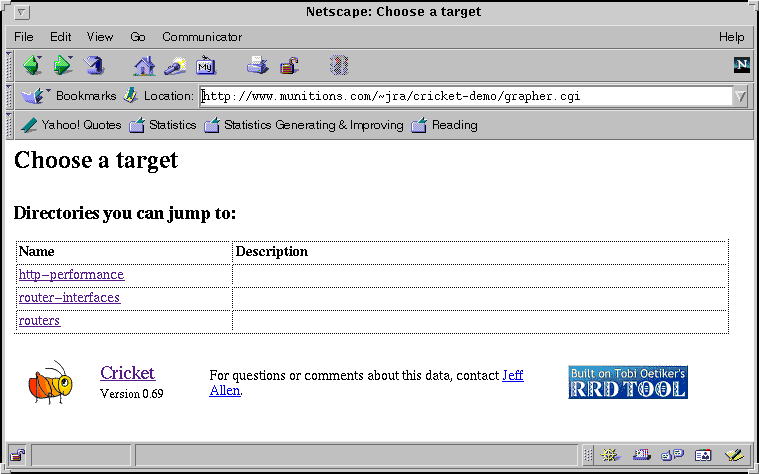
Clicking on the router link takes you to this page:
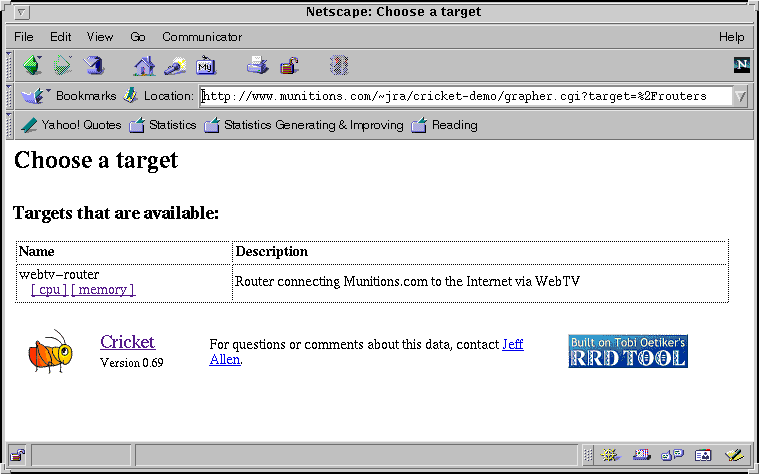
Finally, clicking on the CPU link shows that actual statistics of the router's CPU usage:
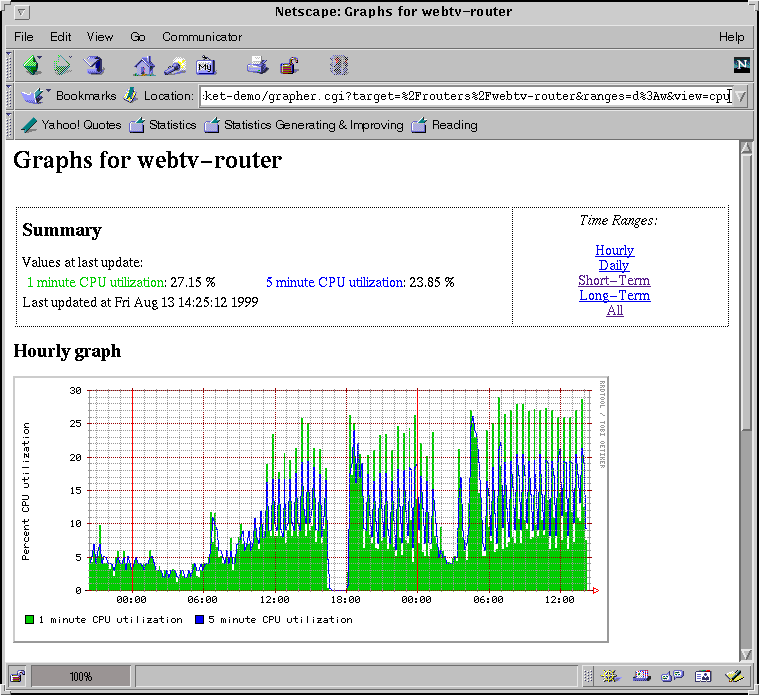
More information about building a Cricket installation, which is not trivial, can be found at the Cricket web page.
RFC 1155 - Structure and Identification of Management
Information for TCP/IP-based Internets
http://www.rfc-editor.org/rfc/rfc1115.txt
Watching your systems in realtime (SunWorld, July 1999)
http://www.orcaware.com/articles/1999_07_01_sunworld.html
UCD-SNMP Home page
http://net-snmp.sourceforge.net/
tkmib - See the UCD-SNMP link
Tk Perl Module
ftp://ftp.funet.fi/pub/languages/perl/CPAN/authors/id/NI-S/
SNMP.pm Perl Module
ftp://ftp.funet.fi/pub/languages/perl/CPAN/authors/id/GSM/
SNMP_Session Perl Module
http://www.switch.ch/misc/leinen/snmp/perl/
zlib - Compression library used to make PNGs
http://www.gzip.org/zlib/
libpng - PNG image library
http://www.libpng.org/pub/png/libpng.html
libgd - GD graphics library
http://www.boutell.com/gd/
Paper about Cricket presented at the Usenix's 1st Conference
on Network Administration.
http://www.munitions.com/~jra/cricket/neta-paper/paper.html
Sun SyMON
http://www.sun.com/symon/
SyMON and SE get upgraded (SunWorld, February 1999)
http://sunsite.uakom.sk/sunworldonline/swol-02-1999/swol-02-perf.html